
JOURNAL
Measuring and Improving Quality — Metrics That Actually Matter
Move beyond vanity metrics. Learn to track test coverage, defect escape rate, flakiness, and automation ROI. Build a quality dashboard and run retrospectives that drive real improvement. Part 9 of the QC team's guide to automation with AI.
On this page
“We have 300 automated tests.” Great. But are they finding bugs? Are they saving time? Are they making releases safer?
Numbers without context are vanity metrics. This post teaches you which metrics actually reflect quality, how to measure them, how to build a dashboard, and how to use retrospectives to drive continuous improvement.
Metrics That Matter vs. Vanity Metrics
| Vanity Metric | Why It Misleads | Better Metric |
|---|---|---|
| Total test count | 300 tests that all pass but test nothing useful? | Critical path coverage — % of key user flows automated |
| 100% code coverage | Every line is executed, but assertions are missing | Assertion density — meaningful checks per test |
| Tests run per day | Running broken tests 100 times is worse than zero | Pass rate over time — is the suite getting healthier? |
| “Green build” | Can mean tests were skipped, mocked, or trivial | Defect escape rate — bugs reaching production |
| Automation hours logged | More hours ≠ better quality | Automation ROI — time saved vs. time invested |
The 5 Metrics Every QC Team Should Track
1. Test Coverage (Meaningful Coverage)
Code coverage (line coverage) tells you which lines were executed during tests. It does not tell you whether those tests verify anything useful.
What to measure instead:
Critical Path Coverage = (Critical user flows with automated tests / Total critical user flows) × 100
Example:
| Critical Flow | Automated? | Status |
|---|---|---|
| User registration | ✅ | Full coverage |
| Login | ✅ | Full coverage |
| Search & filter products | ✅ | Happy path only |
| Add to cart | ❌ | Manual only |
| Checkout | ❌ | Manual only |
| Password reset | ✅ | Full coverage |
| User profile update | 🔶 | Partial (missing validation) |
Coverage: 4/7 fully automated = 57%
Target: 80%+ of critical flows fully automated by end of quarter.
How to Generate Coverage Reports
// playwright.config.ts
export default defineConfig({
  use: {
    // Enable trace on first retry (useful for debugging failures)
    trace: 'on-first-retry',
  },
  // Generate test reports
  reporter: [
    ['html', { open: 'never' }],
    ['json', { outputFile: 'reports/results.json' }],
  ],
});
# Generate and view coverage report
npx playwright test
npx playwright show-report
2. Defect Escape Rate
This is the most important metric for your stakeholders. It answers: “How many bugs are reaching users despite our testing?”
Defect Escape Rate = (Bugs found in production / Total bugs found) × 100
Target: Below 10%. If 90%+ of bugs are caught before production, your automation is working.
How to track:
| Sprint | Bugs Found Pre-Release | Bugs Found in Prod | Escape Rate | |——–|———————-|——————–|-_____| | Sprint 1 (no automation) | 12 | 8 | 40% | | Sprint 2 (basic automation) | 15 | 5 | 25% | | Sprint 3 (POM + fixtures) | 20 | 3 | 13% | | Sprint 4 (AI-assisted) | 25 | 2 | 7% |
This table tells a powerful story to stakeholders: automation is catching bugs before users do.
3. Test Reliability (Flakiness Rate)
A flaky test passes sometimes and fails sometimes with no code change. It’s the #1 trust killer for automation.
Flakiness Rate = (Tests that flaked in last 30 days / Total tests) × 100
Target: Below 2%. One flaky test is a nuisance. Ten flaky tests mean nobody trusts CI.
How to identify flaky tests:
// playwright.config.ts
export default defineConfig({
  // Retry failed tests — if it passes on retry, it was flaky
  retries: 2,

  reporter: [
    ['html', { open: 'never' }],
  ],
});
After running tests, the Playwright report shows which tests needed retries. If a test consistently needs retries, it’s flaky.
Common causes and fixes:
| Flakiness Cause | Symptom | Fix |
|---|---|---|
| Race condition | Test passes locally, fails in CI | Add explicit waitFor or use expect().toBeVisible() |
| Hardcoded timeout | waitForTimeout(3000) |
Replace with auto-retrying assertions |
| Shared state | Test B fails when run after Test A | Make each test independent |
| Animation interference | Click misses because of animation | Wait for animation to complete |
| Test order dependency | Passes in isolation, fails in sequence | Reset state in beforeEach |
Protocol for Flaky Tests
## Flaky Test Protocol

1. **First flake:** Note it, investigate within 48 hours
2. **Second flake:** Tag as @flaky, create an issue
3. **Third flake:** Quarantine (move to non-blocking suite)
4. **Fix deadline:** 1 sprint to fix quarantined tests
5. **Not fixed:** Delete and rewrite from scratch
4. Test Execution Time
How long does your full test suite take? This directly impacts developer productivity.
Test Suite Duration = Time from "tests start" to "all tests complete"
Targets:
| Suite | Target Duration | When It Runs |
|---|---|---|
| Smoke tests | < 2 minutes | Every PR |
| E2E regression | < 10 minutes | Every merge to main |
| Full suite (including visual) | < 30 minutes | Nightly |
How to speed up slow suites:
// playwright.config.ts
export default defineConfig({
  // Run tests in parallel across workers
  workers: process.env.CI ? 4 : undefined,

  // Run tests within a file in parallel
  fullyParallel: true,

  projects: [
    {
      name: 'smoke',
      testMatch: /.*\.smoke\.spec\.ts/,
      retries: 0,
    },
    {
      name: 'regression',
      testMatch: /.*\.spec\.ts/,
      retries: 2,
    },
  ],
});
5. Automation ROI
This is what justifies your automation investment to management.
Monthly Time Saved = (Manual test time per cycle × Cycles per month) - (Automation execution time × Cycles per month)
Automation ROI = (Monthly Time Saved × Monthly Cost per QC Hour) / Monthly Automation Investment
Example Calculation:
| Item | Manual | Automated |
|---|---|---|
| Full regression test time | 8 hours | 15 minutes |
| Regression cycles per month | 4 | 20 (every PR) |
| Monthly testing time | 32 hours | 5 hours |
| Monthly time saved | — | 27 hours |
| QC hourly cost | $40 | — |
| Monthly savings | — | $1,080 |
| Automation investment (setup) | — | 80 hours one-time |
| Payback period | — | ~3 months |
After 3 months, every hour spent on automation saves ~5 hours of manual testing.
Building a Quality Dashboard
You don’t need a fancy tool. A simple spreadsheet updated weekly works. But if you want something more professional, here’s the structure:
Dashboard Sections
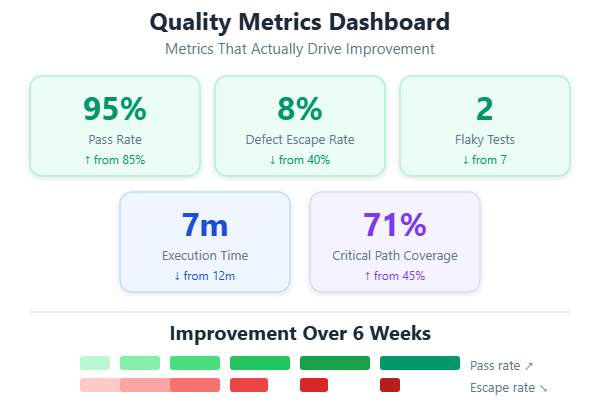
1. Test Health Summary (updated daily by CI)
┌────────────────────────────────────────┐
│ TEST HEALTH DASHBOARD — Week of Mar 3  │
├────────────────────────────────────────┤
│                                        │
│ Pass Rate:     ████████████░░  92%     │
│ Flaky Tests:   ██░░░░░░░░░░░░   3     │
│ Coverage:      ██████████░░░░  71%     │
│ Avg Duration:  7m 23s                  │
│                                        │
│ Defect Escape Rate:  ██░░░░░░░░  8%   │
│ Tests Added This Week: +12            │
│ Tests Fixed This Week: +3             │
│                                        │
└────────────────────────────────────────┘
2. Trend Charts (weekly snapshots)
Track these weekly and plot them:
| Week | Pass Rate | Flaky Count | Coverage | Execution Time | Escape Rate |
|---|---|---|---|---|---|
| W1 | 85% | 7 | 45% | 12m | 22% |
| W2 | 88% | 5 | 52% | 11m | 18% |
| W3 | 91% | 4 | 58% | 9m | 15% |
| W4 | 92% | 3 | 63% | 8m | 12% |
| W5 | 94% | 2 | 68% | 7m | 9% |
| W6 | 95% | 2 | 71% | 7m | 8% |
Every row tells a story: pass rate going up, flakiness going down, coverage growing, speed improving, fewer bugs escaping. This is the narrative you bring to management.
3. Bug Prevention Score
Bugs Caught by Automation This Month:
├── E2E Tests:        14 bugs caught
├── API Tests:         8 bugs caught
├── Visual Tests:      5 bugs caught
├── BDD Scenarios:     3 bugs caught
└── Total:            30 bugs prevented from reaching production
Continuous Improvement: Quality Retrospectives
Monthly Quality Retrospective (1 hour)
Attendees: QC team + Dev lead + 1-2 developers
Agenda:
1. Review the dashboard (10 min)
- Are metrics trending in the right direction?
- Any surprises?
2. What went well? (15 min)
- Which tests caught real bugs this month?
- Which AI-generated tests saved the most time?
- What collaboration improvements worked?
3. What needs improvement? (15 min)
- Which tests are still flaky?
- What critical flows don’t have automation yet?
- Where is the AI output quality poor?
4. Action items (20 min)
- Pick 3 specific improvements for next month
- Assign owners and deadlines
Example Action Items
## Quality Retro — March Actions

1. **Fix the 3 flaky tests** (Owner: QC Lead, Due: Mar 10)
   - Identified root cause: shared test database state
   - Fix: Use unique test data per run

2. **Automate the checkout flow** (Owner: QC Senior, Due: Mar 20)
   - Currently manual-only, highest risk area
   - Use Claude + MCP for initial generation

3. **Add visual regression for mobile** (Owner: Dev + QC, Due: Mar 25)
   - Desktop visual tests exist, mobile does not
   - Configure mobile viewports in Playwright config
Case Study: From Zero to Confidence
Here’s a real improvement timeline for a team adopting automation:
Month 1: Foundation
- Actions: Set up Playwright, write first 10 tests for login and registration
- Results: Pass rate 70% (learning curve), 0 critical path coverage
Month 2: Pattern Adoption
- Actions: Introduced POM, created Page Objects, fixed flaky tests
- Results: Pass rate 88%, 25% critical path coverage, 3 bugs caught
Month 3: AI Integration
- Actions: Added Claude + MCP, started generating tests with AI, doubled test count
- Results: Pass rate 93%, 55% critical path coverage, 12 bugs caught
Month 4: Team Collaboration
- Actions: Shared repo, Dev review process, Definition of Done
- Results: Pass rate 96%, 72% critical path coverage, Escape rate dropped to 8%
Month 5: Continuous Improvement
- Actions: Quality dashboard, monthly retros, prompt library
- Results: Pass rate 97%, 82% critical path coverage, Escape rate 5%
The story: In 5 months, the team went from zero automation to catching 95% of bugs before production, with tests running in 7 minutes instead of 8 hours of manual testing.
Series Navigation
- Part 1: From Manual Tester to Automation Engineer — The Mindset Shift
- Part 2: How to Plan Automation for Any Project — A Practical Framework
- Part 3: Your First Playwright Test — A Step-by-Step Guide for Manual Testers
- Part 4: Page Objects, Fixtures, and Real-World Playwright Patterns
- Part 5: BDD with Cucumber and Playwright — Writing Tests in Plain English
- Part 6: Using AI to Write Tests — Claude, GitHub Copilot, and Antigravity
- Part 7: The QC Tester’s Prompt Engineering Playbook
- Part 8: Sharing the Work — How Dev and QC Teams Collaborate on Test Automation
- Part 9: Measuring and Improving Quality — Metrics That Actually Matter (you are here)
- Part 10: The Complete Best Practices Checklist for Automation, AI, and Quality
In Part 10, the finale, we’ll compile everything from the entire series into one comprehensive best practices checklist — your go-to reference for automation, AI, and quality.
Related reading

30 Sep 2026 · 4 min read
ai-agents
Cloudflare Threw an LLM at Its Own WAF — the Real Lesson Isn't the 49 Bugs It Found
1,107 attack attempts, 49 findings, 3 new detection rules. But the number that should change how you test security is the one Cloudflare almost buried: category diversity beat attempt count, every time.
Read more
13 Sep 2026 · 5 min read
agentic coding
Claude Code Ships Plugin Evals: Now You Can Prove a Skill Actually Does Something
Claude Code v2.1.269 adds claude plugin eval — six grader types, a no-plugin baseline, and CI flags like --threshold and --max-cost-usd. A Tech Lead's walkthrough of what it fixes and how to wire it into a release gate.
Read more
04 Sep 2026 · 5 min read
agents
GPT-6 Astra and the Computer-Use Agent: What Changes When There's No API to Call
OpenAI's GPT-6 Astra ships with a 1M-token context window and browser/computer control that works by reading pixels, not APIs. A Tech Lead's take on what this actually unlocks, where it breaks, and how to design review gates before you let it touch production systems.
Read more
Discussion
Comments are reviewed before publication. Your email is kept private.