
JOURNAL
SEO Analytics & Reporting — Measuring What Actually Matters
Master SEO analytics and reporting in 2026. Build actionable dashboards with GA4 and Google Search Console. Track the right KPIs, calculate SEO ROI, and create reports that stakeholders actually read. Part 11 of the SEO Leader's Complete Playbook.
On this page
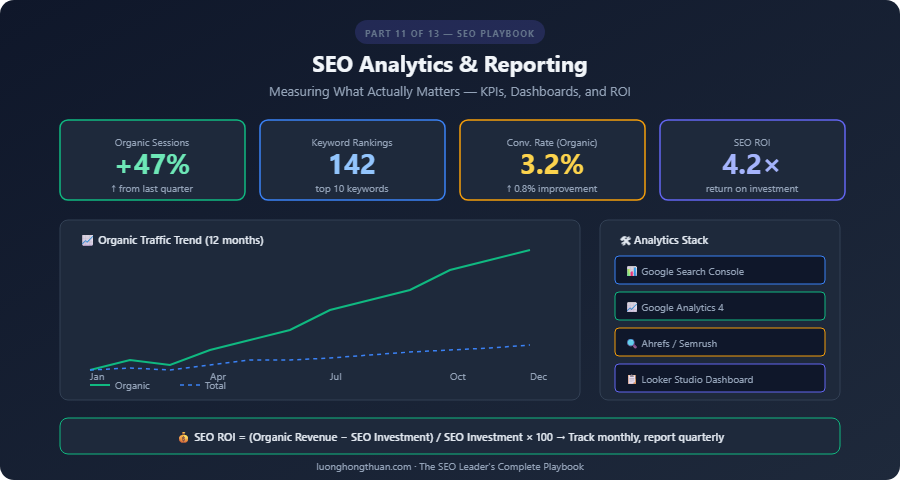
You can’t improve what you don’t measure — but you also can’t improve anything by measuring everything. SEO analytics is about tracking the right metrics, interpreting them correctly, and communicating results in a way that drives action. This guide covers exactly what to measure, how to build dashboards that matter, and how to calculate the actual ROI of your SEO investment.
This is Part 11 of the SEO Leader’s Complete Playbook.
The SEO KPIs That Actually Matter
Primary KPIs (Report These to Stakeholders)
| KPI | What It Measures | Tool | Target |
|---|---|---|---|
| Organic Traffic | Total visits from organic search | GA4 | Month-over-month growth |
| Organic Revenue/Conversions | Business outcomes from organic | GA4 | Tie directly to revenue |
| Keyword Rankings | Positions for target keywords | Ahrefs, Semrush, GSC | Top 10 for priority keywords |
| Organic Click-Through Rate | % of impressions that get clicks | GSC | Above industry average (~3-5%) |
| Core Web Vitals | LCP, INP, CLS pass rate | GSC, PageSpeed Insights | All pages pass “Good” threshold |
Secondary KPIs (Track Internally)
| KPI | What It Measures | Tool |
|---|---|---|
| Indexed Pages | Pages Google has indexed | GSC Coverage Report |
| Backlink Growth | New referring domains per month | Ahrefs, Semrush |
| Domain Authority/Rating | Overall site authority | Moz DA / Ahrefs DR |
| Organic Impressions | How often you appear in search | GSC |
| Pages per Session | Content engagement depth | GA4 |
| Bounce Rate | Single-page visits | GA4 |
| Average Engagement Time | How long users interact | GA4 |
| Crawl Errors | Technical issues | GSC |
Vanity Metrics to Stop Reporting
- Total pageviews (without context) — doesn’t indicate SEO performance
- Keyword rankings for hundreds of terms — focus on priority keywords only
- Social media followers — not an SEO metric
- Domain Authority changes of ±1-2 — normal fluctuation, not meaningful
Google Search Console: Your SEO Command Center
Essential GSC Reports
Performance Report:
- Filter by search type (Web, Image, Video, News)
- Compare date ranges (this month vs. last month, vs. last year)
- Group by query to see keyword performance
- Group by page to see content performance
- Filter by country for international sites
Key Performance Report Analyses:
1. Rising keywords:
   - Filter: Last 28 days vs previous 28 days
   - Sort by: Impressions (ascending → new keywords appearing)
   - Action: Create/optimize content for rising keywords

2. Declining keywords:
   - Filter: Last 28 days vs previous 28 days
   - Sort by: Clicks (descending), look for click drops
   - Action: Refresh content for declining pages

3. High impression, low CTR:
   - Filter: Impressions > 1000, CTR < 3%
   - Action: Improve title tags and meta descriptions

4. Position 4-10 keywords:
   - Filter: Average position between 4 and 10
   - Action: Optimize these pages — they're close to page 1 top spots
Indexing Report:
- Monitor “Not indexed” pages — are important pages excluded?
- Check “Crawled — currently not indexed” for content quality issues
- Review “Discovered — not yet indexed” for crawl budget issues
Core Web Vitals Report:
- Check “Good URLs” percentage for mobile and desktop
- Identify pages with poor CWV metrics
- Track improvement over time after optimization
GSC API for Custom Dashboards
# Example: Extract top queries from GSC API
from googleapiclient.discovery import build
from google.oauth2.credentials import Credentials

service = build('searchconsole', 'v1', credentials=creds)

request = {
    'startDate': '2026-02-01',
    'endDate': '2026-02-28',
    'dimensions': ['query'],
    'rowLimit': 100,
    'dimensionFilterGroups': [{
        'filters': [{
            'dimension': 'country',
            'operator': 'equals',
            'expression': 'vnm'
        }]
    }]
}

response = service.searchanalytics().query(
    siteUrl='https://luonghongthuan.com',
    body=request
).execute()
Google Analytics 4: User Behavior Intelligence
Essential GA4 Reports for SEO
Traffic Acquisition Report:
- Filter: Session default channel group = Organic Search
- Metrics: Sessions, engaged sessions, engagement rate, conversions
- Compare with other channels to show SEO’s relative contribution
Landing Page Report:
- Shows which pages users enter the site on
- Key metric: Engagement rate (high = good content-intent match)
- Low engagement rate on a landing page = intent mismatch
User Engagement:
- Average engagement time per page
- Scroll depth events (configure as custom event)
- Outbound link clicks
Custom GA4 Explorations for SEO
Exploration 1: Organic User Path
Technique: Path exploration
Starting point: Session medium = organic
Path: Landing page → Next page → Next page
Insight: How organic users navigate your site
Exploration 2: Content Performance
Technique: Free form
Dimensions: Landing page, Session source/medium
Metrics: Sessions, engagement rate, conversions
Filter: Medium = organic
Insight: Which content drives the most valuable organic traffic
Building SEO Dashboards
Dashboard Structure
A good SEO dashboard has three layers:
1. Executive Summary (1 page)
- Total organic traffic trend (line chart, 12 months)
- Organic conversions/revenue (bar chart)
- 3-5 headline metrics with month-over-month change
- Top 3 wins and top 3 opportunities
2. Performance Details (2-3 pages)
- Keyword ranking distribution (top 3, 4-10, 11-20, 20+)
- Top 10 pages by organic traffic
- New vs decline pages
- Core Web Vitals status
- Backlink growth trend
3. Action Items (1 page)
- Content to create (from gap analysis)
- Content to refresh (declining performance)
- Technical issues to fix
- Link building priorities
Tool Recommendations
| Tool | Best For | Cost |
|---|---|---|
| Google Looker Studio | Free dashboards, GSC/GA4 integration | Free |
| Databox | Multi-source dashboards, automated reports | $72+/mo |
| AgencyAnalytics | Client reporting, white-label | $79+/mo |
| SEOmonitor | Forecast-based SEO tracking | Custom |
| Supermetrics | Data connectors for spreadsheets/BI tools | $39+/mo |
Calculating SEO ROI
The SEO ROI Formula
SEO ROI = (Value of Organic Conversions − SEO Investment) / SEO Investment × 100

Example:
- Monthly organic conversions: 500
- Average conversion value: $50
- Monthly organic revenue: $25,000
- Monthly SEO investment: $5,000 (tools + team + content)
- SEO ROI: ($25,000 − $5,000) / $5,000 × 100 = 400%
Calculating Non-E-commerce SEO Value
For lead generation and content sites, assign values to non-revenue conversions:
| Conversion | Estimated Value | Method |
|---|---|---|
| Newsletter signup | $5-15 | Based on % that become customers |
| Contact form submission | $50-200 | Based on close rate × average deal size |
| Content download | $10-30 | Based on lead nurture conversion rate |
| Free trial signup | $100-500 | Based on trial-to-paid conversion rate |
SEO vs Paid: Cost Comparison
Paid search for same keywords: $15,000/month in ad spend
Organic traffic cost: $5,000/month in SEO investment
Monthly savings: $10,000
Annual savings: $120,000
+ Organic traffic compounds over time; paid stops when you stop paying
Rank Tracking Best Practices
What to Track
- Branded keywords (your brand name, product names)
- Priority non-branded keywords (top 20-50 target terms)
- Long-tail cluster keywords (representative samples per cluster)
- SERP feature presence (featured snippets, PAA, AI Overviews)
- Local pack positions (if applicable)
Tracking Frequency
| Keyword Set | Tracking Frequency | Why |
|---|---|---|
| Priority keywords (top 20) | Daily | Catch rapid changes, algorithm updates |
| Secondary keywords (top 100) | Weekly | Track trends without noise |
| Long-tail (200+) | Monthly | Identify new opportunities |
| Competitor keywords | Weekly | Monitor competitive landscape |
Hands-On: Build a Monthly SEO Report
Step 1: Data Collection (15 minutes)
- Export GSC performance data (queries, pages, countries)
- Export GA4 organic traffic and conversion data
- Pull keyword ranking data from Ahrefs/Semrush
- Check Core Web Vitals status in GSC
Step 2: Create Executive Summary (10 minutes)
This month's SEO highlights:
- Organic traffic: X sessions (+Y% vs last month)
- Organic conversions: X (+Y% vs last month)
- New keywords in top 10: X
- Core Web Vitals: X% pages passing

Key wins:
1. [Page X] reached position #1 for [keyword]
2. Organic traffic grew X% year-over-year
3. [X] new backlinks from authority sites

Areas for improvement:
1. [Page Y] dropped from position 3 to 7
2. Mobile CWV needs attention on [section]
3. Content refresh needed for [declining pages]
Step 3: Detailed Analysis (20 minutes)
- Top 10 performing pages with traffic and conversions
- Keyword movement chart (improved, declined, new)
- Backlink growth and referring domains
- Technical health score
Step 4: Action Plan (10 minutes)
- 3-5 specific actions for next month
- Priority ranking (high/medium/low)
- Expected impact
- Owner and deadline
Key Takeaways
- Track KPIs that drive decisions — organic traffic, conversions, priority keyword rankings
- GSC is your primary SEO data source — master the Performance and Indexing reports
- Build layered dashboards — executive summary, detail pages, action items
- Calculate SEO ROI — prove value with actual revenue/lead data
- Report monthly — consistent cadence builds stakeholder confidence
- Focus on trends, not snapshots — month-over-month and year-over-year comparisons
What’s Coming Next
In Part 12, we consolidate everything into The Complete SEO Best Practices Checklist — a daily reference your team can use to ensure nothing is missed.
Full Series Navigation
- Part 1: SEO in the AI Era — What Changed, What Didn’t, and What You Must Do Now
- Part 2: The Complete Technical SEO Audit — A 100-Point Checklist
- Part 3: On-Page SEO Mastery — From Title Tags to Topical Authority
- Part 4: Off-Page SEO & Link Building — The Authority Playbook
- Part 5: Core Web Vitals & PageSpeed — Getting a Perfect Score
- Part 6: Content Strategy for SEO — Topic Clusters, Pillar Pages, and Content That Ranks
- Part 7: Advanced Keyword Research — From Search Intent to Semantic Strategy
- Part 8: SEO for AI — How to Get Cited by ChatGPT, Google AI Overviews, and Perplexity
- Part 9: AI-Powered SEO Workflow — Tools, Automation, and Prompt Engineering
- Part 10: Local SEO & International SEO — Ranking Everywhere
- Part 11: SEO Analytics & Reporting — Measuring What Actually Matters (you are here)
- Part 12: The Complete SEO Best Practices Checklist — Your Team’s Daily Reference
- Part 13: SEO in Action — Step-by-Step for luonghongthuan.com, inkviet.com & cublearn.app
Related reading
10 Mar 2026 · 10 min read
case-study
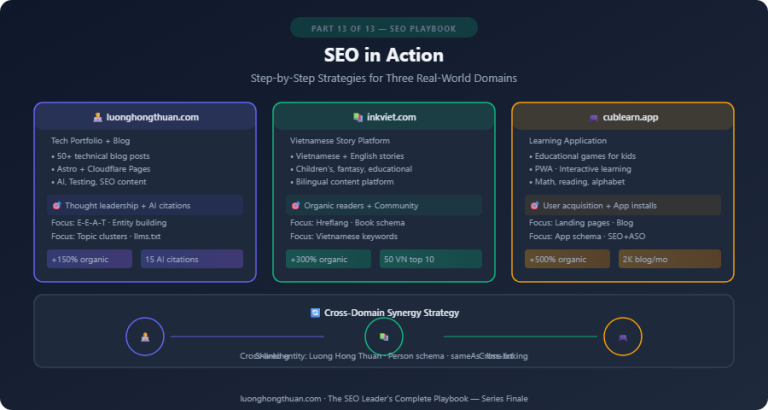
SEO in Action — Step-by-Step Strategies for luonghongthuan.com, inkviet.com & cublearn.app
Real-world SEO implementation for three domains: a tech portfolio blog, a Vietnamese story platform, and a learning app. Complete domain-specific audits, keyword strategies, content plans, AI visibility optimization, and a cross-domain synergy strategy. Part 13 of the SEO Leader's Complete Playbook.
Read more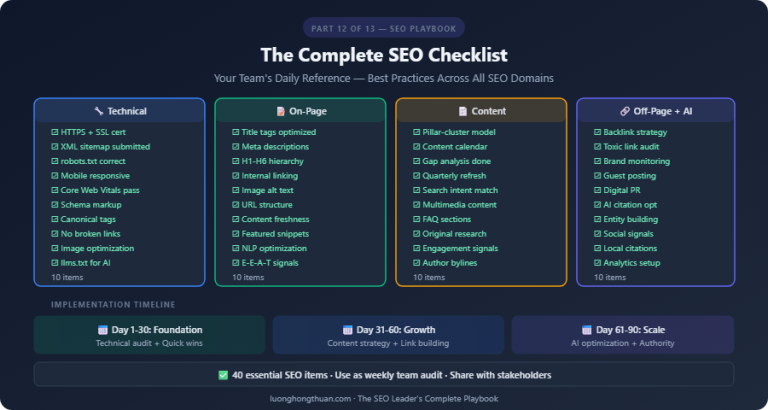
09 Mar 2026 · 8 min read
best-practices
The Complete SEO Best Practices Checklist — Your Team's Daily Reference
The ultimate SEO checklist for 2026. Every best practice from technical SEO, on-page, off-page, content strategy, Core Web Vitals, AI optimization, and analytics — consolidated into a single actionable reference. Includes 30/60/90-day implementation plans. Part 12 of the SEO Leader's Complete Playbook.
Read more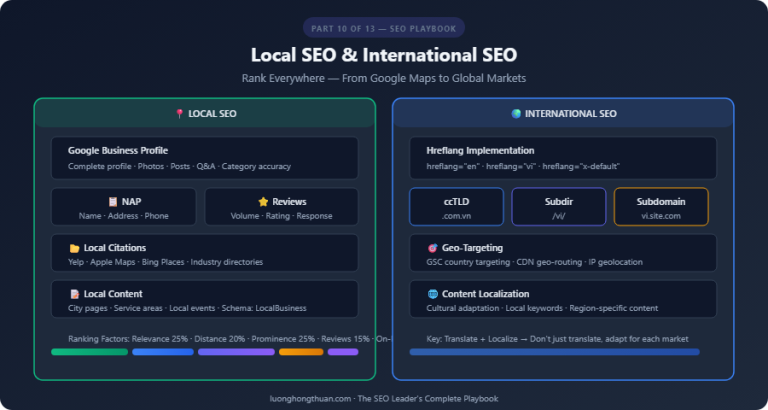
07 Mar 2026 · 6 min read
google-business
Local SEO & International SEO — Ranking Everywhere
Complete guide to local SEO and international SEO in 2026. Master Google Business Profile optimization, local citations, NAP consistency, review management, hreflang implementation, geo-targeting, and multi-region site architecture. Part 10 of the SEO Leader's Complete Playbook.
Read more
Discussion
Comments are reviewed before publication. Your email is kept private.