
BÀI VIẾT
Xây Dựng AI Agent Dashboard: Giám Sát Infra, Quality và Platform Tại Một Nơi
Hướng dẫn thực tế xây dựng AI monitoring dashboard tích hợp EC2 health, web platform status, CI/CD quality checks, dùng Claude để phân tích bất thường bằng ngôn ngữ tự nhiên.
Trong bài viết
Sau 15 năm làm việc với hệ thống .NET, cloud, và gần đây là AI, tôi nhận ra một vấn đề lặp đi lặp lại ở hầu hết mọi team: chúng ta có quá nhiều tool giám sát, nhưng không có góc nhìn thống nhất.
CloudWatch báo CPU tăng. Datadog báo latency cao. GitHub Actions fail. PagerDuty gửi alert. Và đội on-call phải mở 5 tab, đọc 3 dashboard, rồi mới hiểu ra: à, deployment vừa lên production làm memory leak, dẫn đến EC2 OOM, Lambda bắt đầu timeout, và người dùng đang thấy lỗi 502.
Không ai thiếu data. Nhưng thiếu context. Alert thì nhiều, nhưng câu trả lời “vậy thì sao?” thì không có.
Đây là lý do tôi xây một AI agent dashboard — nơi mọi tín hiệu hạ tầng và chất lượng đều về một chỗ, và Claude chịu trách nhiệm đặt câu hỏi đó thay cho đội ops.
Kiến Trúc Tổng Quan
Hệ thống gồm 5 lớp, mỗi lớp có trách nhiệm rõ ràng:
graph TB
    subgraph Sources["Data Sources"]
        CW[CloudWatch<br/>EC2 / RDS / Lambda / ECS]
        HTTP[HTTP Ping Agents<br/>Web App Uptime]
        GH[GitHub API<br/>CI/CD Status]
        API[API Health Checks<br/>Response Time / Error Rate]
    end

    subgraph Collect["Data Collection Layer"]
        Worker[Node.js / Python Workers<br/>Poll every 30s]
    end

    subgraph Store["Storage Layer"]
        TS[(Time-series DB<br/>InfluxDB / Postgres)]
        Cache[(Redis Cache<br/>Latest snapshot)]
    end

    subgraph AI["AI Analysis Layer"]
        Claude[Claude API<br/>Anomaly Detection<br/>Natural Language Summary]
    end

    subgraph UI["Dashboard UI"]
        Cards[Status Cards]
        Graphs[Trend Graphs]
        Summary[AI Summary Panel]
    end

    subgraph Alert["Alert Layer"]
        WA[WhatsApp]
        Slack[Slack]
    end

    Sources --> Collect
    Collect --> Store
    Store --> AI
    AI --> UI
    AI --> Alert
    Store --> UI
Không có gì phức tạp về mặt hạ tầng. Điểm khác biệt nằm ở lớp AI — thay vì chỉ hiện số, ta đưa số đó vào Claude để hỏi: “Cái này có nghĩa gì không?”
Lớp 1: Thu Thập Dữ Liệu
Worker Node.js chạy mỗi 30 giây, gom dữ liệu từ CloudWatch và ping HTTP đồng thời:
// collector/infra-agent.js
import { CloudWatchClient, GetMetricStatisticsCommand } from "@aws-sdk/client-cloudwatch";
import { EC2Client, DescribeInstanceStatusCommand } from "@aws-sdk/client-ec2";

const cw = new CloudWatchClient({ region: process.env.AWS_REGION });
const ec2 = new EC2Client({ region: process.env.AWS_REGION });

async function collectEC2Health(instanceId) {
  const now = new Date();
  const start = new Date(now - 5 * 60 * 1000); // 5 phút trước

  const [cpuRes, statusRes] = await Promise.all([
    cw.send(new GetMetricStatisticsCommand({
      Namespace: "AWS/EC2",
      MetricName: "CPUUtilization",
      Dimensions: [{ Name: "InstanceId", Value: instanceId }],
      StartTime: start,
      EndTime: now,
      Period: 60,
      Statistics: ["Average", "Maximum"],
    })),
    ec2.send(new DescribeInstanceStatusCommand({
      InstanceIds: [instanceId],
    })),
  ]);

  const datapoints = cpuRes.Datapoints.sort((a, b) => a.Timestamp - b.Timestamp);
  const latestCpu = datapoints.at(-1)?.Average ?? null;
  const status = statusRes.InstanceStatuses[0];

  return {
    instanceId,
    cpuAvg: latestCpu,
    instanceStatus: status?.InstanceStatus?.Status ?? "unknown",
    systemStatus: status?.SystemStatus?.Status ?? "unknown",
    healthCheckFails: status?.InstanceStatus?.Details?.filter(
      d => d.Status !== "passed"
    ).length ?? 0,
    collectedAt: now.toISOString(),
  };
}

async function pingEndpoint(url, timeout = 5000) {
  const start = Date.now();
  try {
    const res = await fetch(url, {
      signal: AbortSignal.timeout(timeout),
      method: "GET",
    });
    return {
      url,
      status: res.status,
      responseMs: Date.now() - start,
      up: res.ok,
    };
  } catch (err) {
    return {
      url,
      status: 0,
      responseMs: Date.now() - start,
      up: false,
      error: err.message,
    };
  }
}

export async function collectAll(config) {
  const [ec2Results, httpResults] = await Promise.all([
    Promise.all(config.ec2Instances.map(collectEC2Health)),
    Promise.all(config.endpoints.map(url => pingEndpoint(url))),
  ]);

  return { ec2: ec2Results, http: httpResults, timestamp: new Date().toISOString() };
}
Kết quả này được lưu vào Redis (snapshot mới nhất) và InfluxDB (chuỗi thời gian để vẽ trend).
Lớp 2: AI Phân Tích Bất Thường
Đây là phần khác biệt thực sự. Mỗi chu kỳ 5 phút, ta gửi snapshot metric vào Claude và yêu cầu tóm tắt bằng ngôn ngữ tự nhiên:
// ai/analyzer.js
import Anthropic from "@anthropic-ai/sdk";

const client = new Anthropic();

export async function analyzeMetrics(snapshot) {
  const prompt = buildPrompt(snapshot);

  const response = await client.messages.create({
    model: "claude-opus-4-5",
    max_tokens: 512,
    system: `Bạn là AI ops analyst cho một hệ thống production.
Nhiệm vụ: phân tích metrics hạ tầng và đưa ra tóm tắt ngắn gọn,
ưu tiên vấn đề nghiêm trọng nhất. Nếu mọi thứ bình thường, nói rõ.
Luôn trả lời bằng tiếng Việt. Không dùng bullet point quá nhiều —
hãy viết như một senior engineer đang briefing cho team lead.`,
    messages: [{ role: "user", content: prompt }],
  });

  return {
    summary: response.content[0].text,
    severity: detectSeverity(snapshot),
    analyzedAt: new Date().toISOString(),
  };
}

function buildPrompt(snapshot) {
  const ec2Lines = snapshot.ec2.map(i =>
    `- ${i.instanceId}: CPU ${i.cpuAvg?.toFixed(1) ?? "N/A"}%, ` +
    `instance status ${i.instanceStatus}, system status ${i.systemStatus}, ` +
    `health check fails: ${i.healthCheckFails}`
  ).join("\n");

  const httpLines = snapshot.http.map(e =>
    `- ${e.url}: ${e.up ? "UP" : "DOWN"} | ${e.responseMs}ms | HTTP ${e.status}`
  ).join("\n");

  return `Đây là snapshot metrics lúc ${snapshot.timestamp}:

**EC2 Instances:**
${ec2Lines}

**HTTP Endpoints:**
${httpLines}

Phân tích trạng thái hệ thống. Có vấn đề gì cần chú ý không?
Nếu có, nguyên nhân có thể là gì và nên làm gì tiếp theo?`;
}

function detectSeverity(snapshot) {
  const highCpu = snapshot.ec2.some(i => i.cpuAvg > 85);
  const healthFails = snapshot.ec2.some(i => i.healthCheckFails > 0);
  const downEndpoints = snapshot.http.filter(e => !e.up).length;
  const slowEndpoints = snapshot.http.filter(e => e.responseMs > 3000).length;

  if (downEndpoints > 0 || (healthFails && highCpu)) return "critical";
  if (highCpu || healthFails || slowEndpoints > 0) return "warning";
  return "ok";
}
Output mẫu từ Claude khi hệ thống gặp vấn đề:
“EC2 instance i-0abc123 ở us-east-1 đang chạy CPU 92% trong 4 điểm đo liên tiếp, kết hợp với 3 health check fail trong 5 phút vừa rồi. Khả năng cao là OOM — process đang dùng hết memory và hệ điều hành bắt đầu swap. Endpoint /api/checkout đang response 4.2s, có thể do cùng nguyên nhân. Gợi ý: scale out thêm 1 instance ngay, sau đó kiểm tra heap dump để xác nhận leak.”
Đây chính xác là thứ on-call engineer cần nghe lúc 2 giờ sáng, không phải một biểu đồ CPU đơn thuần.
Lớp 3: Dashboard UI
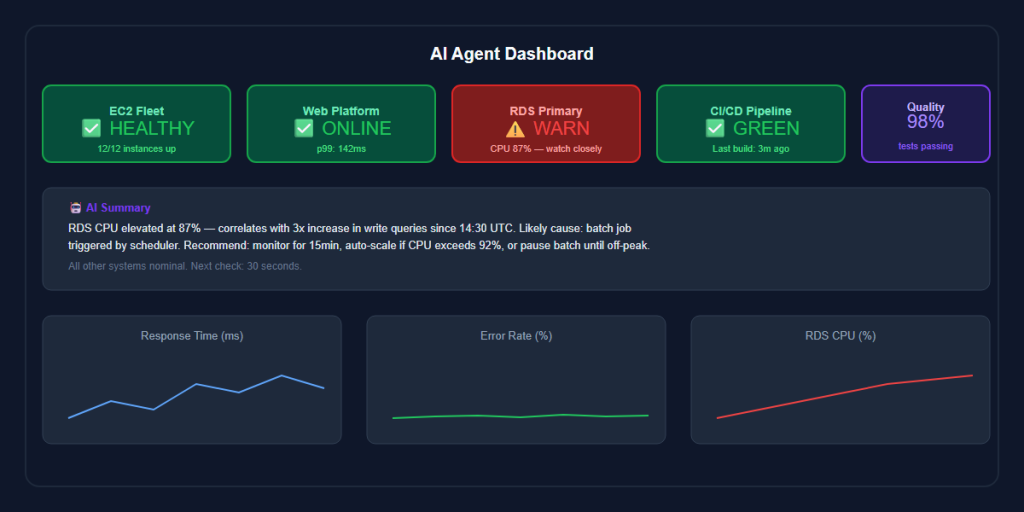
Dashboard chia làm 3 vùng chính:
Status Cards — mỗi card là một tài nguyên, màu sắc theo severity:
- Xanh: OK
- Vàng: Warning (CPU > 70%, response > 1s)
- Đỏ: Critical (down, health fail, CPU > 85%)
Trend Graphs — InfluxDB + Grafana hoặc Recharts nếu dùng Next.js. Hiện CPU 1 giờ gần nhất, response time P95, error rate.
AI Summary Panel — phần quan trọng nhất. Hiện tóm tắt mới nhất từ Claude, timestamp, và severity badge. Refresh mỗi 5 phút.
// components/AISummaryPanel.tsx
export function AISummaryPanel({ summary, severity, analyzedAt }: Props) {
  const borderColor = {
    ok: "border-green-500",
    warning: "border-yellow-500",
    critical: "border-red-500 animate-pulse",
  }[severity];

  return (
    <div className={`border-l-4 ${borderColor} bg-gray-900 rounded p-4`}>
      <div className="flex items-center gap-2 mb-2">
        <span className="text-xs text-gray-400">AI Analysis</span>
        <span className="text-xs text-gray-500">· {formatRelative(analyzedAt)}</span>
      </div>
      <p className="text-sm text-gray-100 leading-relaxed">{summary}</p>
    </div>
  );
}
Tích Hợp Quality Check
Infra monitoring chỉ là một nửa. Platform quality cần thêm:
API Contract Tests — chạy Postman collections hoặc k6 scripts mỗi 10 phút, push kết quả vào cùng pipeline metrics. Nếu /api/auth/login trả 200 nhưng response body thiếu field token, đó là bug API mà HTTP ping không bắt được.
Synthetic Monitors — Playwright script giả lập user flow: login → add to cart → checkout. Nếu flow break ở bước nào, system biết ngay mà không cần user report.
CI/CD Status — GitHub API poll workflow runs, push trạng thái deployment mới nhất vào dashboard. Claude có thể correlate: “Deployment lúc 14:32 trùng với thời điểm error rate tăng 3x.”
// collector/github-agent.js
async function getLatestWorkflowRun(owner, repo, workflow) {
  const res = await fetch(
    `https://api.github.com/repos/${owner}/${repo}/actions/workflows/${workflow}/runs?per_page=1`,
    { headers: { Authorization: `Bearer ${process.env.GITHUB_TOKEN}` } }
  );
  const data = await res.json();
  const run = data.workflow_runs[0];
  return {
    id: run.id,
    status: run.status,
    conclusion: run.conclusion,
    createdAt: run.created_at,
    updatedAt: run.updated_at,
    htmlUrl: run.html_url,
  };
}
Deploy Thực Tế
Option 1: Docker + Cron — đơn giản nhất cho team nhỏ:
FROM node:22-alpine
WORKDIR /app
COPY package*.json ./
RUN npm ci --production
COPY . .
CMD ["node", "src/collector/index.js"]
Kết hợp với Docker Compose chạy collector, Redis, InfluxDB, và Grafana cùng một lúc. Cron job trong container gọi collector mỗi 30 giây.
Option 2: AWS Lambda + EventBridge — production-grade, không cần quản lý server:
- Lambda function chạy collector và AI analyzer
- EventBridge rule trigger mỗi 1 phút
- Kết quả lưu vào DynamoDB (snapshot) + Timestream (time-series)
- CloudFront + S3 serve dashboard static files
- API Gateway expose
/api/snapshotđể dashboard poll
Với Lambda, cost gần như bằng 0 cho team nhỏ — 1 invocation/phút là khoảng 44k invocations/tháng, nằm trong free tier.
Bài Học Quan Trọng
Sau vài tháng chạy hệ thống này, tôi học được điều quan trọng nhất: AI không thay thế Grafana. Nó thêm layer “vậy thì sao?” lên raw metrics.
Grafana giỏi trả lời “cái gì đang xảy ra” — CPU bao nhiêu, latency bao nhiêu, error rate bao nhiêu. Nhưng nó không trả lời “tại sao” và “cần làm gì tiếp theo.”
Claude không phải oracle. Nó sẽ sai khi thiếu context về hệ thống cụ thể của bạn. Nhưng nó cực kỳ giỏi ở việc pattern matching — nhận ra rằng CPU tăng + health check fail + latency cao cùng lúc sau một deployment là dấu hiệu quen thuộc của memory leak, không phải traffic spike.
Ba quy tắc tôi áp dụng:
- Không alert mù — mọi alert từ AI phải kèm reasoning. Nếu Claude không giải thích được tại sao nó coi đây là vấn đề, alert bị drop.
- Human-in-the-loop cho action — AI tóm tắt và gợi ý, nhưng không tự động scale hay restart instance. Quyết định vẫn là của engineer.
- Feed context, không chỉ numbers — prompt tốt hơn khi có thêm “deployment xảy ra lúc X”, “traffic pattern thường tăng lúc 9h sáng”, “RDS maintenance window là thứ 6”. Càng nhiều context, Claude phân tích càng chính xác.
Dashboard này không giải quyết mọi vấn đề ops. Nhưng nó giải quyết một vấn đề cụ thể: giúp on-call engineer hiểu chuyện gì đang xảy ra trong 60 giây đầu, thay vì mất 15 phút mở tab và đọc log.
Và đôi khi, đó là sự khác biệt giữa incident 30 phút và incident 3 tiếng.
Bài viết liên quan
08 Oct 2026 · 5 phút đọc
devops
Kubernetes vừa đổi một default khiến node cũ của bạn không boot lên được
Field failCgroupV1 của kubelet đổi default thành true từ bản 1.35. Node chỉ chạy cgroup v1 giờ không khởi động được nữa trừ khi bạn override. Cách kiểm tra ngay hôm nay.
Đọc tiếp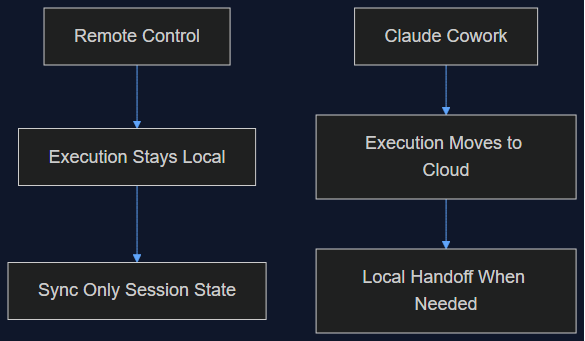
06 Oct 2026 · 6 phút đọc
agentic coding
Claude Cowork vừa làm đúng cái mình từng nói Remote Control không làm
Tháng 8 mình viết rằng Remote Control của Claude Code chỉ là một lớp đồng bộ, không phải di chuyển lên cloud, và việc giữ execution ở local chính là điểm cốt lõi. Tuần này Anthropic chuyển hẳn execution của Cowork lên cloud làm mặc định. Đây là lý do cả hai quyết định đều đúng — cho hai sản phẩm khác nhau.
Đọc tiếp
03 Oct 2026 · 5 phút đọc
agents
950 Agent, 21 Giờ, 210 Triệu Token: Cuộc Tìm CRISPR Của Anthropic Thực Sự Chứng Minh Điều Gì Về Fan-Out
Lab khoa học sự sống của Anthropic chạy 950 agent song song để tìm ra một hệ enzyme giống CRISPR có thể là mới. Toán học của cái funnel là một pattern fan-out thật sự hữu ích — nhưng phần phản ứng của giới khoa học mới là đoạn đáng đọc kỹ.
Đọc tiếp
Thảo luận
Bình luận được duyệt trước khi công khai. Email của bạn được giữ riêng tư.