
JOURNAL
Data-Driven Product Strategy: How OTT Platforms Win with Personalization
A deep dive into how Netflix, Disney+, and streaming leaders use data, recommendation engines, and engagement loops to reduce churn and grow watch time.
On this page
Data-Driven Product Strategy: How OTT Platforms Win with Personalization
The streaming wars are not won by content alone. They are won by product.
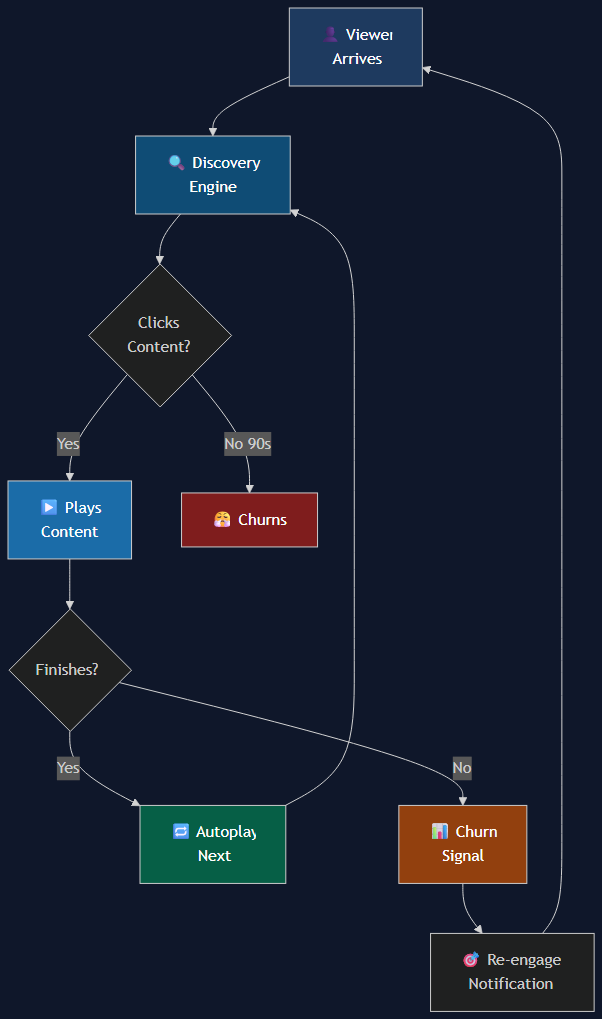
Netflix has over 17,000 titles. Disney+ carries an entire century of IP. YouTube adds 500 hours of video every minute. But here is the brutal truth: the average viewer makes a decision in 90 seconds or less. If your product cannot surface the right content in that window, you lose them — sometimes for good.
This is the core tension of OTT product strategy: infinite content, finite attention. And solving it requires building data-driven systems at every layer of the user experience.
The OTT Engagement Problem
Paradox of choice is not just a behavioral economics concept — it is a real product failure mode. When a viewer opens Netflix and sees 200 rows of content, cognitive overload kicks in. They scroll. They preview. They close the app.
Product teams at streaming platforms obsess over a metric called browse abandonment rate: the percentage of sessions where a user opens the app, spends time scrolling, and exits without watching anything. This number directly predicts churn. Reduce browse abandonment and retention improves. Allow it to creep up and you will see it in your monthly active user numbers three months later.
The product’s job is clear: compress the decision. Make finding the right content feel effortless, even inevitable.
Three Layers of Personalization
World-class OTT platforms operate personalization at three distinct layers, each building on the last.
Layer 1: Content Discovery
This is the recommendation engine — the system that decides what appears on your homepage, in what order, and in what category row.
Netflix uses a hybrid approach combining collaborative filtering (users who watched X also enjoyed Y) with content-based filtering (this show shares genre, pacing, and tone with things you liked). The result is a homepage that is unique to every user — two people sitting side by side will see completely different content rows.
The key algorithmic signals Netflix trains on:
- Completion rate: Did you finish the episode? The season?
- Genre affinity: Which genres consistently lead to completion vs. abandonment?
- Viewing time slots: Do you watch action films on weekday nights but documentaries on Sunday mornings?
- Interaction velocity: How quickly did you click after seeing the thumbnail?
Netflix has reported that 80% of watch time on the platform comes from recommendations — not search, not browsing editorial rows. This is the single most important product statistic in streaming. It means the recommendation engine is not a feature; it is the core product.
Layer 2: Engagement Hooks
Once a user is watching, the product’s job shifts to keeping the session alive and bringing them back.
Autoplay next episode is the most powerful engagement hook Netflix ever shipped. The default 5-second countdown before the next episode starts eliminated the “decision moment” that caused session drop-off. Users went from actively choosing to continue to actively choosing to stop — a complete reversal of the default behavior.
Personalized thumbnails are less visible but equally impactful. Netflix A/B tested thumbnail images across its entire catalog and discovered that different users respond to different visual signals. A user who watches romantic dramas is more likely to click on a thumbnail showing two characters in an emotional moment. A user who watches thriller content responds to tension-filled, high-contrast imagery. Netflix now serves personalized artwork to every user, and the click-through rate improvement was significant enough to roll out platform-wide.
Notification timing is the third hook. When should the push notification for a new season drop? Netflix models each user’s active hours and sends the notification in the window when that specific user is most likely to open the app. Not 9 AM because that is when marketing says “morning peak” — but Tuesday at 7:15 PM because that is when you specifically tend to start a viewing session.
Layer 3: Retention Signals
The most sophisticated layer is the one users never see: the churn prediction model.
Netflix and other top-tier platforms track behavioral signals that predict cancellation weeks before it happens:
- Drop in weekly active days — a user who watched 5 days per week dropping to 2 is a strong churn signal
- Episode completion without continuation — finishing an episode but not starting the next one, especially across multiple titles
- Notification ignore rate — ignoring 3+ push notifications in a 7-day window
- Increased time-to-click — taking longer than usual to find content to watch (browse abandonment building)
When these signals cluster, the platform triggers re-engagement flows: a carefully timed email highlighting a new season of content the model predicts they will like, a discounted offer, or a personalized “Because you watched…” notification.
The Data Stack Behind It All
None of this personalization is possible without a robust behavioral data layer. Every interaction a viewer has with an OTT platform generates a signal:
- Play, pause, skip, rewind events — a rewind on a specific scene is a strong positive signal; a skip in the first 3 minutes of content is a strong negative signal
- Content metadata: genre, cast, director, mood, pacing, themes, runtime
- Contextual signals: device type (TV vs. mobile), time of day, day of week, inferred viewing environment
- Search queries: what did the user look for, and did the results satisfy them?
The combination of these signals, at scale, is what separates Netflix’s recommendation quality from platforms that rely purely on editorial curation.
Netflix Case Study: The Thumbnail Experiment
In 2016, Netflix published details of one of its most impactful A/B tests. The company tested different thumbnail images for the same titles across its user base. The key finding: thumbnails featuring human faces with visible emotion drove 35% higher click-through rates than scene-wide shots or title cards.
This single insight drove a platform-wide architecture change. Netflix built a system to:
- Generate multiple thumbnail variations per title (often 20–30 variations)
- Test them against user segments
- Serve the winning thumbnail — personalized by user cluster — to the entire user base
The downstream effect was not just higher click-through rates. It was higher completion rates, because users who clicked on content they genuinely wanted to watch were more likely to finish it. One test, compounding across the entire engagement funnel.
Spotify Wrapped and Disney+: Personalization Beyond Recommendations
Spotify Wrapped is a masterclass in using personalization as a retention and acquisition tool. By surfacing a user’s annual listening data in a shareable, visual format, Spotify created a moment that users voluntarily share on social media — turning personal data into viral marketing. The product insight: your data, made visible to you in a compelling way, feels like a gift. Wrapped drives a measurable spike in subscription renewals in December.
Disney+ has taken a different personalization path, leaning into franchise and universe-based content affinity. If you watch The Mandalorian, the algorithm surfaces Star Wars content across all formats — films, animated series, documentaries. Disney’s product bet is that franchise loyalty is the strongest content affinity signal, and the data supports it: franchise viewers have significantly higher 12-month retention than non-franchise viewers.
Product Lessons for OTT Leaders
If you are a product lead at an OTT platform — or building product strategy for a media company entering streaming — here are the frameworks that matter:
1. Watch time ≠ satisfaction Average watch time per session is a vanity metric. What matters is quality of engagement: did the user finish what they started? Did they immediately look for something else (positive signal) or close the app (negative signal)? Platforms that optimize for raw watch time often see engagement inflate short-term while satisfaction scores drop.
2. The first 7 days are everything Onboarding and first content match predict 3-month retention more accurately than any other variable. A user who finds content they love in their first session is significantly more likely to become a long-term subscriber. Invest disproportionately in the onboarding recommendation experience.
3. Platform trust is fragile One bad recommendation cycle — suggesting content the user explicitly dislikes — can drop session depth by 40% in the following week. Users do not articulate this; they simply open the app less. Building negative feedback signals (thumbs down, “not interested”) into the recommendation loop is essential for long-term trust.
4. Localization is a product decision, not a translation task Local trending rows, cultural event tie-ins, regional content prioritization — these are product decisions that affect engagement for specific user segments. Platforms that treat localization as subtitles leave significant retention improvement on the table.
5. A/B test everything, ship nothing blind Even button placement on the pause screen affects session length. The most sophisticated OTT product teams run hundreds of concurrent experiments across their platforms. If you are making product decisions based on intuition or industry benchmarks alone, you are guessing.
What Vietnam OTT Platforms Can Learn
VieON, FPT Play, and Galaxy Play face the same fundamental product challenge as Netflix: infinite content, finite attention. But most local platforms still rely primarily on editorial curation — human-selected content rows and marketing-driven placements.
The data advantage is available. Vietnamese users generate behavioral signals the same way any streaming audience does. The opportunity: even basic collaborative filtering (“users who watched X also watched Y”) significantly outperforms editorial for content discovery, particularly for mid-catalog content that editorial teams never surface.
The specific investments worth making for Vietnam OTT:
- Mobile-first personalization: The majority of OTT consumption in Vietnam is on mobile. Thumbnail optimization and notification timing matter more on mobile than on TV.
- Sports and live content integration: Live sports drive spike engagement. Integrating real-time viewing behavior into recommendation signals (halftime engagement, post-match browsing) is an untapped opportunity.
- Price tier personalization: With multiple subscription tiers, product teams can use engagement data to identify users at risk of downgrade — and surface high-value content before they make that decision.
The Product Lead’s Framework
Good OTT product strategy can be expressed as a simple equation:
Content × Discovery × Retention = Platform Value
You can have the best content library in the market. Without discovery, it is invisible — users will not find it in 90 seconds of scrolling. You can have excellent discovery. Without retention, you acquire users and then watch them cancel after the one show they came for ends.
The platforms that win in streaming are not the ones with the largest content budgets. They are the ones that build the most sophisticated data flywheel: more data → better recommendations → more engagement → more data. Netflix started this flywheel in 2006. The question for every OTT product leader today is: when did you start yours?
The answer to the engagement problem is not more content. It is better product.
Related reading

26 May 2026 · 11 min read
ai
Everyone's Asking Me About AI Trends. Here's What I Actually Think.
Stop asking what AI will do next. Start asking what you will do with it. A Product Lead and Tech Lead breakdown of the signals worth paying attention to in 2026.
Read more23 Mar 2026 · 6 min read
agile
Agile English: Writing User Stories and Acceptance Criteria That Get Approved
Practical English templates and phrases for Vietnamese developers writing user stories, acceptance criteria, and backlog items that product owners and international teams actually understand.
Read more
08 Mar 2026 · 43 min read
edtech
Building KidSpark: Monetization, Growth, and the Road Ahead (Part 10 of 10)
Part 10 of 10 — The final chapter. Ethical monetization for kids apps, growth strategies that don't exploit children, and honest lessons from building KidSpark from idea to production.
Read more
Discussion
Comments are reviewed before publication. Your email is kept private.