
JOURNAL
Building an AI Agent Dashboard: Monitor Infra, Quality, and Platforms in One Place
A practical guide to building an AI-powered monitoring dashboard that shows EC2 health, web platform status, CI/CD quality checks, and uses Claude to interpret anomalies in plain English.
On this page
Building an AI Agent Dashboard: Monitor Infra, Quality, and Platforms in One Place
After fifteen years of building and running production systems — .NET monoliths, distributed microservices, cloud-native stacks on AWS — the alert fatigue problem has not changed. If anything, it has gotten worse. You have CloudWatch for your EC2 and RDS metrics, a separate tool for uptime monitoring, GitHub Actions emails for failed pipelines, Datadog or Grafana for APM, and maybe a custom Slack bot someone wired up in 2022 that half the team has muted. Each tool tells you something happened. None of them tell you what it means or what to do next.
This is the problem I set out to solve with what I now call an AI Agent Dashboard: a unified surface that collects data from every layer of your stack, normalizes it, and then runs it through Claude to produce plain-English summaries that a team member — even one who didn’t deploy the service — can act on immediately.
The Architecture
Before diving into code, here is how all the pieces connect:
flowchart TD
    subgraph Collection["Data Collection Layer (every 30s)"]
        CW[AWS CloudWatch\nEC2 · RDS · Lambda · ECS]
        HTTP[HTTP Ping Agents\nuptime · latency · error rate]
        GH[GitHub API\nCI/CD pipeline status]
    end

    subgraph Coordination["Agent Coordination Layer (Node.js workers)"]
        Poller[Polling Orchestrator]
        Normalizer[Metric Normalizer\nJSON schema]
        Store[(Time-series Store\nRedis / InfluxDB)]
    end

    subgraph AI["AI Analysis Layer"]
        Claude[Claude API\nsonnet model]
        Summary[Structured Summary\n+ severity score]
    end

    subgraph UI["Dashboard UI (Next.js)"]
        Cards[Status Cards]
        Graphs[Trend Graphs]
        AISummary[AI Summary Panel]
    end

    subgraph Alerts["Alert Layer"]
        WA[WhatsApp]
        Slack[Slack]
    end

    CW --> Poller
    HTTP --> Poller
    GH --> Poller
    Poller --> Normalizer --> Store
    Store --> Claude
    Claude --> Summary
    Summary --> Cards
    Summary --> Graphs
    Summary --> AISummary
    Summary -->|severity >= HIGH| WA
    Summary -->|severity >= HIGH| Slack
Five layers. Each has a single responsibility. The AI layer sits between the raw data store and the UI — it does not replace visualization, it augments it with interpretation.
Layer 1: Data Collection — Node.js Polling Agent
The collection worker runs on a 30-second interval. It fans out three concurrent checks: AWS SDK calls for infrastructure metrics, HTTP probes for platform health, and GitHub API calls for CI status. All results are normalized into a common schema before being stored.
// agents/collector.ts
import { CloudWatchClient, GetMetricDataCommand } from "@aws-sdk/client-cloudwatch";
import { ECSClient, ListServicesCommand, DescribeServicesCommand } from "@aws-sdk/client-ecs";

const cw = new CloudWatchClient({ region: process.env.AWS_REGION ?? "us-east-1" });
const ecs = new ECSClient({ region: process.env.AWS_REGION ?? "us-east-1" });

export async function collectEC2Health(instanceId: string): Promise<MetricSnapshot> {
  const end = new Date();
  const start = new Date(end.getTime() - 5 * 60 * 1000); // last 5 min

  const command = new GetMetricDataCommand({
    MetricDataQueries: [
      {
        Id: "cpu",
        MetricStat: {
          Metric: { Namespace: "AWS/EC2", MetricName: "CPUUtilization",
            Dimensions: [{ Name: "InstanceId", Value: instanceId }] },
          Period: 60, Stat: "Average",
        },
      },
      {
        Id: "statusFailed",
        MetricStat: {
          Metric: { Namespace: "AWS/EC2", MetricName: "StatusCheckFailed",
            Dimensions: [{ Name: "InstanceId", Value: instanceId }] },
          Period: 60, Stat: "Sum",
        },
      },
    ],
    StartTime: start,
    EndTime: end,
  });

  const result = await cw.send(command);
  const cpu = result.MetricDataResults?.find(r => r.Id === "cpu")?.Values?.[0] ?? 0;
  const failedChecks = result.MetricDataResults?.find(r => r.Id === "statusFailed")?.Values
    ?.reduce((a, b) => a + b, 0) ?? 0;

  return { instanceId, cpu, failedChecks, timestamp: end.toISOString() };
}

export async function pingEndpoint(url: string): Promise<PingResult> {
  const start = performance.now();
  try {
    const res = await fetch(url, { signal: AbortSignal.timeout(5000) });
    const latencyMs = Math.round(performance.now() - start);
    return { url, status: res.status, latencyMs, ok: res.ok, timestamp: new Date().toISOString() };
  } catch (err) {
    return { url, status: 0, latencyMs: -1, ok: false, error: String(err), timestamp: new Date().toISOString() };
  }
}

export async function getGitHubPipelineStatus(owner: string, repo: string): Promise<PipelineStatus> {
  const res = await fetch(
    `https://api.github.com/repos/${owner}/${repo}/actions/runs?per_page=5`,
    { headers: { Authorization: `Bearer ${process.env.GITHUB_TOKEN}` } }
  );
  const data = await res.json();
  const latest = data.workflow_runs?.[0];
  return {
    repo: `${owner}/${repo}`,
    conclusion: latest?.conclusion ?? "unknown",
    status: latest?.status ?? "unknown",
    runUrl: latest?.html_url,
    timestamp: latest?.updated_at,
  };
}
This gives you a flat, typed snapshot per resource. All snapshots go into Redis with a TTL of 10 minutes, keyed by resource ID and timestamp. InfluxDB works better if you need long-term trend queries.
Layer 2: AI Analysis — Calling Claude to Interpret Metrics
Once you have a normalized snapshot of all resources, you bundle it into a prompt and send it to Claude. The key design decision here is to ask Claude for structured output — a JSON envelope with a human-readable summary and a machine-readable severity score. The severity score drives the alert layer; the summary drives the UI.
// agents/analyzer.ts
import Anthropic from "@anthropic-ai/sdk";

const client = new Anthropic(); // reads ANTHROPIC_API_KEY from env

interface AnalysisResult {
  severity: "OK" | "WARNING" | "HIGH" | "CRITICAL";
  summary: string;
  recommendations: string[];
  affectedResources: string[];
}

export async function analyzeMetrics(snapshot: SystemSnapshot): Promise<AnalysisResult> {
  const prompt = `
You are a DevOps monitoring agent. Analyze the following infrastructure and platform metrics snapshot
and return a JSON object with this exact shape:
{
  "severity": "OK" | "WARNING" | "HIGH" | "CRITICAL",
  "summary": "<1-3 sentence plain-English description of system state>",
  "recommendations": ["<actionable step>", ...],
  "affectedResources": ["<resource id or name>", ...]
}

Rules:
- OK: all healthy, no anomalies
- WARNING: degraded but not urgent (CPU 70-85%, latency 200-500ms)
- HIGH: needs attention soon (CPU >85%, failed health checks, pipeline failures)
- CRITICAL: immediate action required (instance down, API returning 5xx, cascading failures)

Current snapshot:
${JSON.stringify(snapshot, null, 2)}
`;

  const message = await client.messages.create({
    model: "claude-sonnet-4-5",
    max_tokens: 512,
    messages: [{ role: "user", content: prompt }],
  });

  const text = message.content[0].type === "text" ? message.content[0].text : "";

  // Extract JSON from the response
  const match = text.match(/\{[\s\S]*\}/);
  if (!match) throw new Error("No JSON found in Claude response");

  return JSON.parse(match[0]) as AnalysisResult;
}
A real example output from this prompt, given an EC2 instance at 92% CPU with 3 failed health checks in 5 minutes:
severity: HIGH
summary: “EC2 instance i-0abc123 in us-east-1 is showing 92% CPU utilization with 3 failed status checks in the last 5 minutes. This pattern is consistent with an OOM condition or a runaway process.”
recommendations: [“Check process list via SSM Session Manager — look for memory-intensive processes”, “Review CloudWatch memory metrics if the CloudWatch agent is installed”, “Consider horizontal scaling: add one instance to the Auto Scaling group”]
This is the “so what?” layer that raw metrics will never give you.
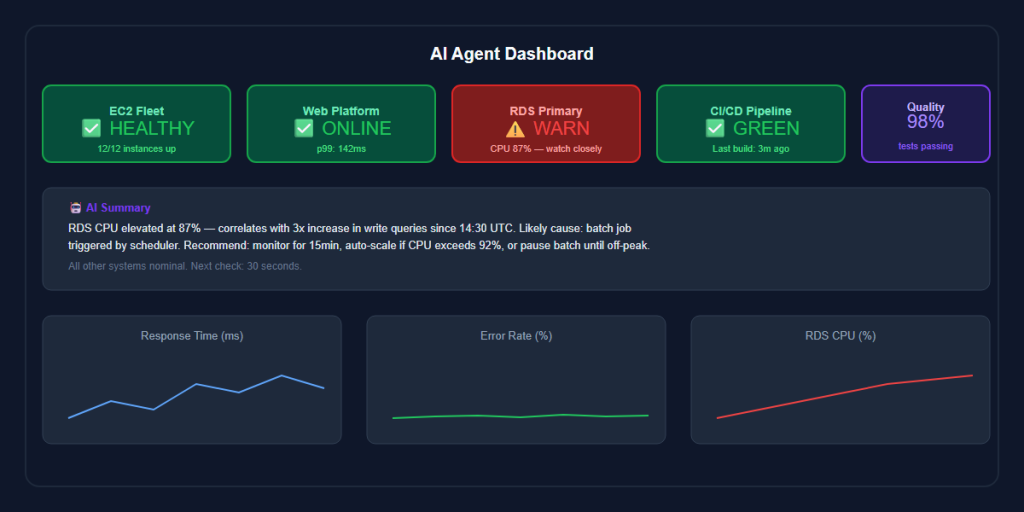
Layer 3: Dashboard UI
The Next.js dashboard subscribes to a /api/status endpoint that returns the latest analysis result from Redis. The layout is intentionally simple: status cards at the top, trend graphs in the middle, AI summary panel at the bottom.
Status Cards — one card per monitored resource (EC2 instance, RDS cluster, each web endpoint, each GitHub repo). Color-coded by severity: green, yellow, orange, red. Shows the last-updated timestamp and a one-line excerpt from the AI summary.
Trend Graphs — sparklines for the last 30 minutes of CPU, latency, and error rate. Not full Grafana — just enough to see direction. Recharts or Chart.js handles this well in Next.js.
AI Summary Panel — the full Claude-generated summary for the current system state, with the recommendations rendered as a checklist. This is what you show on the wall monitor in the office or share in the team Slack channel during an incident.
Quality Check Integration
The same HTTP ping agent handles synthetic monitors. Point it at your critical user journeys — the checkout flow, the login endpoint, the key API surfaces — and treat them as first-class resources in the snapshot. For existing test suites, pipe your Postman/Newman results or Playwright test reports into the normalizer via a webhook. A CI step that posts { "suite": "e2e", "passed": 47, "failed": 2, "duration": 94 } to your collector endpoint is enough. Claude will pick up failed test counts as signals in its analysis.
Deployment
For small teams, Docker Compose with a cron trigger is sufficient: one container for the Next.js UI, one for the Node.js collector, one Redis instance. The collector runs as a cron job every 30 seconds via node-cron.
For production scale, replace the cron container with an AWS Lambda function triggered by EventBridge on a 1-minute schedule. The Lambda writes to ElastiCache (Redis) and triggers a second Lambda for AI analysis when severity crosses a threshold. This keeps costs low — you are only invoking Claude when the data warrants it, not on every poll.
# docker-compose.yml (local / staging)
services:
  redis:
    image: redis:7-alpine
  collector:
    build: ./agents
    environment:
      - AWS_REGION=us-east-1
      - ANTHROPIC_API_KEY=${ANTHROPIC_API_KEY}
      - GITHUB_TOKEN=${GITHUB_TOKEN}
    depends_on: [redis]
  dashboard:
    build: ./dashboard
    ports: ["3000:3000"]
    depends_on: [redis]
The Key Lesson
Grafana is not going away. Neither is CloudWatch, Datadog, or whatever APM tool you are already running. The AI layer does not replace them — it sits on top and answers the question your on-call engineer asks at 2am: “Is this bad? What do I do?”
Raw metrics tell you a number. AI analysis tells you a story. The dashboard is where both live together, and the result is a monitoring system that every engineer on the team — not just the one who built the service — can understand and act on. That is the real value: reducing the gap between “alert fired” and “team knows what to do.” After fifteen years of watching teams lose that gap at the worst possible moments, I am convinced this is where AI earns its place in the production stack.
The full working implementation is available on GitHub. Start with the collector and one endpoint — you do not need all five layers running before it becomes useful.
Related reading
08 Oct 2026 · 4 min read
devops
Kubernetes Just Flipped a Default That Will Refuse to Boot Your Old Nodes
Kubelet's failCgroupV1 field defaulted to true in 1.35. A cgroup v1-only node won't start anymore unless you explicitly override it. Here's how to check today.
Read more08 Oct 2026 · 4 min read
architecture
English Lesson — Wednesday Morning: Failover & High Availability Vocabulary
Wednesday architecture English: failover, pronunciation drills, a vocabulary table, two exercises, and an idiom every on-call engineer should know.
Read more
07 Oct 2026 · 4 min read
ai
English Lesson — Tuesday Morning: Embeddings & Vector Search Vocabulary
Daily English practice for tech professionals: embed, vector database, and nearest neighbor search vocabulary with pronunciation and exercises.
Read more
Discussion
Comments are reviewed before publication. Your email is kept private.