
JOURNAL
AI Observability in 2026: How to Monitor What Your Agents Are Actually Doing
As AI agents replace human workflows, your observability stack must evolve. A practical guide to tracing LLM calls, multi-agent chains, and tool use with OpenTelemetry — from a Tech Lead who's been there.
On this page
AI Observability in 2026: How to Monitor What Your Agents Are Actually Doing
The uncomfortable truth: Most teams deploying AI agents in 2026 have no idea what those agents are actually doing at runtime. They trust the output. They ignore the path.
I’ve spent the last 18 months building production AI systems — retrieval pipelines, multi-agent workflows, tool-calling chains. One thing became clear very quickly: the failure modes of AI are completely different from the failure modes of traditional software, and our observability tooling hasn’t caught up.
This post is what I wish I had read before we started.
Why Traditional Observability Fails for AI Agents
In a traditional microservices system, a request fails because:
- A service returned a non-200 status code
- A database query timed out
- A null pointer exception was thrown
- Latency exceeded your SLA threshold
These are deterministic, catchable, and alertable with standard tooling. Add Prometheus metrics and OpenTelemetry traces and you’re mostly covered.
AI agents fail differently:
- Hallucinated tool calls — the agent calls a function with plausible but wrong arguments
- Reasoning loops — the agent gets stuck reasoning in circles without calling any tool
- Context drift — after 20 tool calls, the agent has “forgotten” the original task
- Silent degradation — outputs become less accurate over time with no error signal
- Emergent coordination failure — in multi-agent systems, agents produce individually valid outputs that are collectively incoherent
None of these produce HTTP errors. None trigger your existing alerts. They just silently produce wrong answers.
What You Actually Need to Observe
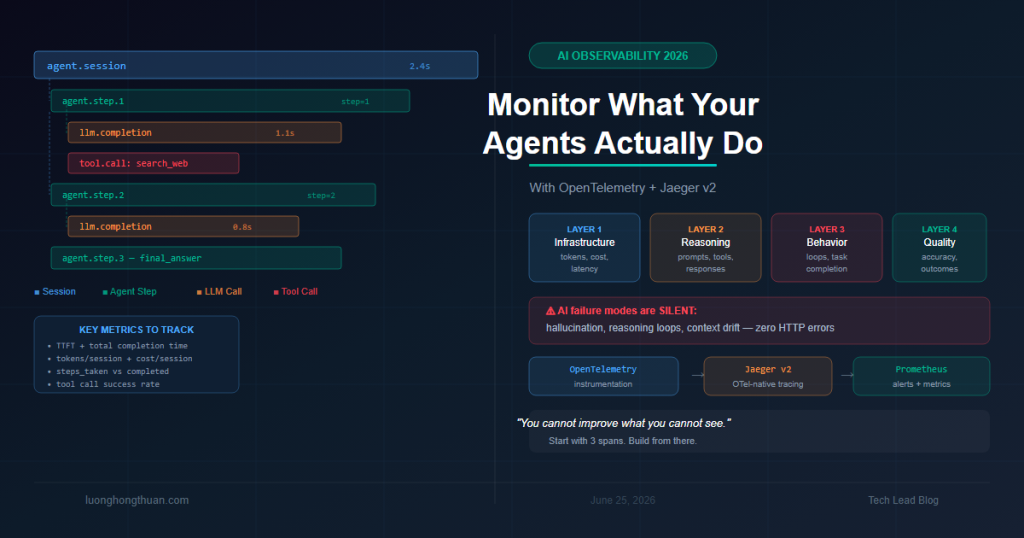
Before picking tools, define what you want to monitor. For AI agent systems, I track four layers:
Layer 1: Infrastructure (same as before)
- Token consumption per request / per agent
- Latency: TTFT (Time to First Token), total completion time
- Error rates from the LLM API (rate limits, context window exceeded)
- Cost per request, cost per user session
Layer 2: Reasoning traces
- What prompt was sent to the LLM?
- What did the LLM respond with?
- Which tools were called, with what arguments, and what did they return?
- How many reasoning steps did the agent take?
Layer 3: Agent behavior
- Did the agent complete its task or bail out?
- Did it call unexpected tools?
- Did it loop more than N times?
- Did the final answer match the expected format?
Layer 4: Outcome quality (hardest)
- Was the output factually correct? (requires LLM-as-judge or human eval)
- Did the user accept or reject the response?
- Did the action the agent took have the intended real-world effect?
You cannot improve what you cannot see. Start with layers 1 and 2. Layer 3 requires structured logging. Layer 4 requires evaluation pipelines.
The OpenTelemetry Approach
OpenTelemetry (OTel) is now the standard for AI agent tracing. The key concept: every LLM call is a span.
Basic Span Structure for an LLM Call
from opentelemetry import trace
from opentelemetry.trace import SpanKind

tracer = trace.get_tracer("ai-agent")

def call_llm(prompt: str, model: str) -> str:
    with tracer.start_as_current_span(
        "llm.completion",
        kind=SpanKind.CLIENT,
        attributes={
            "llm.model": model,
            "llm.prompt.tokens": count_tokens(prompt),
            "llm.prompt.template": "research_agent_v2",
        }
    ) as span:
        response = anthropic_client.messages.create(
            model=model,
            messages=[{"role": "user", "content": prompt}],
            max_tokens=2048
        )

        span.set_attribute("llm.completion.tokens", response.usage.output_tokens)
        span.set_attribute("llm.finish_reason", response.stop_reason)
        span.set_attribute("llm.cost.usd", calculate_cost(response.usage))

        return response.content[0].text
This gives you a trace entry for every LLM call with token counts, cost, and model info attached.
Tracing a Tool Call Chain
The real power comes when you trace the entire agent loop — not just individual LLM calls, but the decision + action + result cycle:
def agent_loop(task: str, tools: list) -> AgentResult:
    with tracer.start_as_current_span("agent.session") as session_span:
        session_span.set_attribute("agent.task", task[:200])
        session_span.set_attribute("agent.tools_available", [t.name for t in tools])

        iteration = 0
        while iteration < MAX_ITERATIONS:
            iteration += 1

            with tracer.start_as_current_span(f"agent.step.{iteration}") as step_span:
                # Call LLM to decide next action
                response = call_llm(build_prompt(task, history))
                action = parse_action(response)

                step_span.set_attribute("agent.step", iteration)
                step_span.set_attribute("agent.action.type", action.type)

                if action.type == "final_answer":
                    session_span.set_attribute("agent.steps_taken", iteration)
                    session_span.set_attribute("agent.completed", True)
                    return AgentResult(answer=action.content)

                # Execute tool
                with tracer.start_as_current_span("tool.call") as tool_span:
                    tool_span.set_attribute("tool.name", action.tool)
                    tool_span.set_attribute("tool.input", str(action.input)[:500])

                    result = execute_tool(action.tool, action.input)

                    tool_span.set_attribute("tool.output_length", len(str(result)))
                    tool_span.set_attribute("tool.success", result.success)

        session_span.set_attribute("agent.completed", False)
        session_span.set_attribute("agent.failure_reason", "max_iterations_exceeded")
        return AgentResult(error="Max iterations exceeded")
Now you get a complete waterfall trace: session → steps → LLM calls → tool calls. You can see exactly where time is spent and where things go wrong.
The Jaeger v2 + OTel Stack for AI
Jaeger v2 recently rebuilt itself as OTel-native, making it an excellent choice for AI agent tracing. The key advantage: you can query across multiple agent sessions to find patterns.
Example Jaeger queries that become possible with proper instrumentation:
# Find all sessions where the agent looped more than 5 times
agent.steps_taken > 5 AND agent.completed = true

# Find all failed tool calls in the last 24h
tool.success = false AND duration > 5s

# Find expensive sessions (>$0.10 cost)
llm.cost.usd > 0.10

# Find sessions that hit max iterations (agent gave up)
agent.failure_reason = "max_iterations_exceeded"
This is qualitatively different from log-based debugging. You can browse agent behavior, not just search for errors.
The Multi-Agent Trace Problem
When you have multiple agents calling each other — a coordinator, a researcher, a code writer — you need to propagate trace context across agent boundaries.
# In the coordinator agent
def delegate_to_researcher(query: str) -> str:
    current_span = trace.get_current_span()
    ctx = trace.set_span_in_context(current_span)

    # Pass trace context to sub-agent call
    headers = {}
    propagate.inject(headers, context=ctx)

    # Sub-agent receives parent context and continues the trace
    result = researcher_agent.invoke(
        query=query,
        trace_context=headers  # passed through your agent protocol
    )
    return result

# In the researcher agent
def invoke(query: str, trace_context: dict) -> str:
    # Extract parent context to continue the trace
    ctx = propagate.extract(trace_context)

    with tracer.start_as_current_span(
        "researcher.agent",
        context=ctx  # linked to parent trace
    ) as span:
        span.set_attribute("agent.type", "researcher")
        span.set_attribute("agent.query", query[:200])
        # ... do the research
With this, a single trace shows the entire multi-agent execution as one connected waterfall, even if the agents run in different services or containers.
Alerts That Actually Matter
Don’t alert on everything. Alert on what changes agent behavior at runtime:
# Example alert rules (Prometheus/Grafana)

- alert: AgentMaxIterationsExceeded
  expr: increase(agent_sessions_total{completed="false",reason="max_iterations"}[5m]) > 3
  for: 2m
  annotations:
    summary: "Agents are hitting iteration limits — check prompt complexity or tool reliability"

- alert: HighLLMCostPerSession
  expr: histogram_quantile(0.95, agent_session_cost_usd) > 0.50
  for: 5m
  annotations:
    summary: "P95 cost per session exceeded $0.50 — may indicate runaway agent loops"

- alert: ToolCallFailureSpike
  expr: rate(tool_calls_total{success="false"}[5m]) > 0.20
  for: 3m
  annotations:
    summary: "Tool call failure rate above 20% — check downstream dependencies"
These alerts tell you something is wrong with agent behavior, not just with infrastructure.
What I Learned the Hard Way
Lesson 1: Log the full prompt, not just a hash. When an agent hallucinates, you need to see exactly what it was given. Yes, this is expensive storage. It is worth it. Implement sampling (log 100% of failures, 10% of successes).
Lesson 2: Measure time-to-first-token separately from total completion time. These have completely different performance profiles and failure modes. A stuck agent and a slow agent look the same in total latency.
Lesson 3: Track token velocity. If token consumption doubles in a week with no traffic change, your prompts are drifting. Someone edited the system prompt and didn’t notice the cost impact.
Lesson 4: Never trust “completed: true”. An agent that returns an answer in 2 iterations and one that returns the same answer after 15 iterations are both “complete.” They are not the same — the 15-iteration one has something wrong with it, even if the output looks correct.
Lesson 5: Instrument before you ship. Adding observability after the fact to a production AI system is the hardest possible time. The prompts are tangled in business logic, the trace context gets dropped, and you have no historical baseline to compare against.
The Stack I Recommend in 2026
| Layer | Tool | Why |
|---|---|---|
| Instrumentation | OpenTelemetry SDK | Standard, vendor-neutral |
| Collector | OTel Collector | Batch, filter, route traces |
| Trace storage | Jaeger v2 | OTel-native, great UI, ML-ready |
| Metrics | Prometheus + Grafana | Alerting, dashboards |
| Cost tracking | Custom spans + BigQuery | Token × model price, per-session |
| LLM-as-judge eval | Anthropic API | Quality scoring at sample rate |
Start Small
You don’t need the full stack on day one. Start here:
- Add a span for every LLM call with model name, token count, and cost
- Add a parent span for each agent session with task description and final status
- Log tool calls with name, input (truncated), and success/failure
Three spans. That’s your MVP. Everything else builds from there.
The hardest part of AI observability is not technical — it is cultural. Teams want to ship agents quickly. Observability feels like overhead. It is not. It is the only way to know if your agent is doing what you think it is doing.
Interested in the full implementation? The code examples above are extracted from a real production system. Connect with me at luonghongthuan.com for questions and deeper dives.
Related reading
08 Oct 2026 · 4 min read
devops
Kubernetes Just Flipped a Default That Will Refuse to Boot Your Old Nodes
Kubelet's failCgroupV1 field defaulted to true in 1.35. A cgroup v1-only node won't start anymore unless you explicitly override it. Here's how to check today.
Read more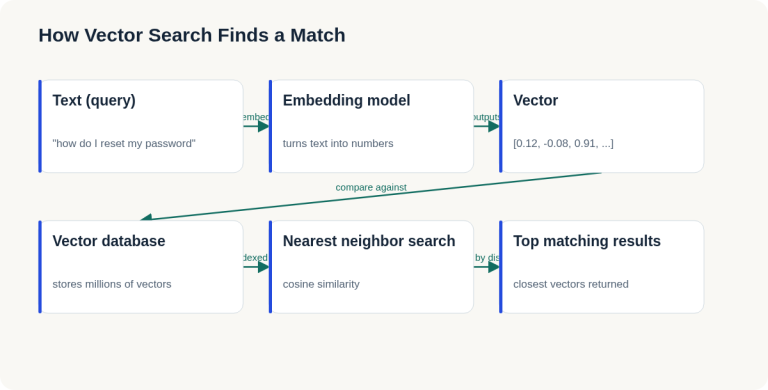
07 Oct 2026 · 4 min read
ai
English Lesson — Tuesday Morning: Embeddings & Vector Search Vocabulary
Daily English practice for tech professionals: embed, vector database, and nearest neighbor search vocabulary with pronunciation and exercises.
Read more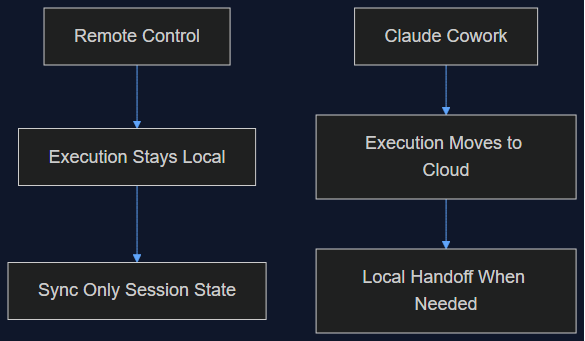
06 Oct 2026 · 5 min read
agentic coding
Claude Cowork Just Did the Thing I Said Remote Control Wasn't Doing
In August I wrote that Claude Code's Remote Control was a sync layer, not a cloud migration, and that keeping execution local was the point. This week Anthropic moved Cowork's execution to the cloud by default. Here's why both were the right call — for different products.
Read more
Discussion
Comments are reviewed before publication. Your email is kept private.