
JOURNAL
27 Companies Tripled Their AI Coding Spend. Almost None Can Prove It Paid Off.
Pragmatic Engineer surveyed 27 companies on AI coding tool spend. Budgets jumped, PR counts jumped further — but when engineers were asked if software actually shipped faster, the answers split. Here is what to measure instead of PR count.

On this page
Gergely Orosz, who writes The Pragmatic Engineer, spent weeks talking to engineering leaders and senior engineers at 27 companies about one question: what are you actually getting back for your AI coding tool spend? He published the results on October 20, 2026. The short version: spend is climbing fast, a simple activity metric (pull requests) is climbing even faster, and almost nobody interviewed could say with confidence that real throughput — value shipped to users — is climbing at the same rate.
The spend numbers are real and they are large
The most dramatic figure in the piece comes from a quantitative trading firm with roughly 2,000 engineers. Its total monthly AI coding tool spend went from about $500,000 in January to about $8 million in September — a 16x increase in nine months. Per-developer average spend at that firm rose from roughly $80/month to roughly $1,600/month over the same period, with an individual cap of $25,000 per employee per month.
That firm is an outlier, but the direction is consistent across the other companies Orosz talked to. A two-person .NET startup reported spending around $3,000/month per developer on tools like Claude Opus and GitHub Copilot. A Series D hospitality company (~200 engineers) set a default cap of $1,500/dev/month and reported actual spend around $2,200/month in September. A publicly traded SaaS company with about 600 engineers capped spend at $1,200/dev/month, with fewer than 5% of developers hitting that ceiling. Other companies in the sample ranged from $1,000/dev/month averages at larger firms to a $4,000/dev/month hard cap at a 10,000+ employee multinational, where actual average spend was closer to $1,000/dev/month. Across the full sample of 27 workplaces, reported budgets ranged from about $150 to roughly $3,000 per developer per month, with Claude and Opus 5.5 the most frequently cited models.
Spend going up is not controversial. Every company in the piece is spending more on AI coding tools than it was a year ago. The harder question is what that spend is buying.
Pull requests went up even faster — and that is exactly the problem
Orosz supplemented the interviews with aggregate data from two AI code-review vendors, CodeRabbit and Gitar. CodeRabbit’s numbers, drawn from a cohort of 20,000 developers using its platform, showed weekly PR volume up 113% and monthly PR volume up 127% year-over-year; tracking the same cohort over a full year showed a 128% increase. Gitar’s data showed a split between “standard” teams generating around 5 PRs per developer per week and “AI-native” teams generating 60 or more.
Individual companies in the interview sample showed similar jumps. A two-person .NET startup (Ix Technologies) went from 1-2 PRs/day per developer to 60 PRs/week (10-15/day) — a 5-10x increase. A team at a 10,000+ employee multinational went from 1.5 to 4 PRs/developer/week, a 4x increase, with the team lead reporting they now close 3x more user stories per month and are delivering more business value. One publicly traded company reported PR size itself increasing roughly 3x in lines of code per change.
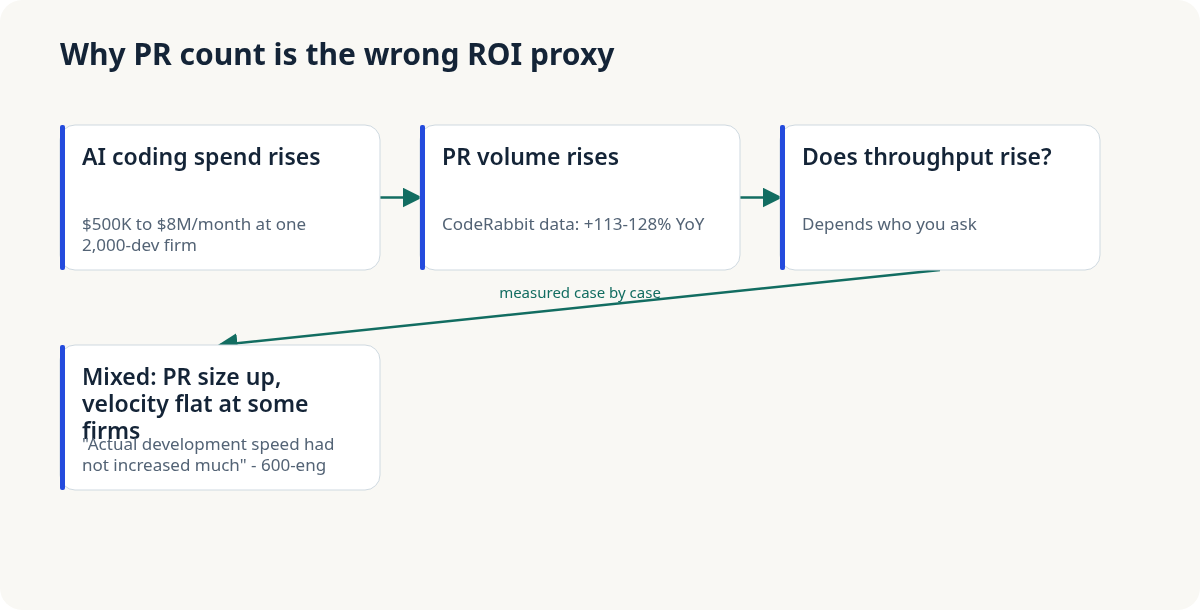
The diagram above is the whole article in four steps. Spend rises. PR volume rises faster. Whether real throughput rises depends entirely on who you ask inside the same company. And the honest middle finding, repeated across several interviews, is that PR size and PR count can both increase without velocity moving at all.
“Actual development speed had not increased much”
The most direct counterweight in the piece comes from a staff engineer at the publicly traded SaaS company with about 600 engineers. That company still runs human PR reviews — the engineer is quoted saying reviewers “catch a lot of stuff that agents miss” — and on the productivity question specifically: “When the team cares about quality in production code and wants to keep it like before AI, then actual development speed had not increased much.”
An engineer at a roughly 100-person AI SaaS company put it more bluntly: “We don’t see anything getting done faster than before.” An engineer at the Series D hospitality company described deliberately holding the line on PR size and quality rather than letting the AI-assisted volume balloon: “We aim to maintain the previous PR standard in terms of PR size and quality.”
Set against that is the multinational team lead’s genuinely positive account — 3x more user stories closed per month, with a claim of more business value delivered, not just more code written. Orosz’s own framing of the state of the industry is blunt: “What’s the ROI of AI? A question that few companies seem able to answer — at least for now.” It is worth noting that every productivity figure in the piece, positive or skeptical, is self-reported by the interviewee or sourced from vendor-aggregated data. There is no instrumented control group anywhere in the sample.
Why PR count keeps winning as the default metric
None of this means engineering leaders measuring PR count are doing something wrong on purpose. PR count wins by default because it is, as Orosz puts it, “a very simple metric, and one of those ‘readily-available’ measurements at nearly all companies” — pulled straight from GitHub, GitLab, or whatever Git host is already in place, with no instrumentation project required. It is also, for now, a metric that has not been gamed the way lines-of-code or commit-count metrics were gamed a decade ago.
But “easy to measure” and “measures the thing that matters” are different properties, and this dataset shows them pulling apart in real time. An AI coding assistant can genuinely make it faster to produce a pull request without making it faster to produce a correct, shippable, reviewed pull request. A model can expand a five-line fix into a fifteen-line fix that does the same job with more surface area to review. Both of those show up as PR growth. Neither is obviously a productivity win, and the hospitality-company engineer’s quote above is a direct description of a team trying to resist exactly that drift.
What to actually measure
If PR count alone cannot answer the ROI question, the fix is not to abandon it — it is cheap and already instrumented, so keep collecting it — but to pair it with at least one signal that tracks outcome, not activity. Based on what this survey surfaces as the actual points of disagreement between teams, four are worth tracking before you trust a PR-growth chart:
- PR size, normalized against PR count. If PR count is up 4x and average PR size (lines changed, files touched) is also up 3x, you have not learned that throughput quadrupled — you may just be looking at the same total amount of code split or inflated differently. Track both numbers side by side, not PR count alone.
- Cycle time from PR open to merge, and from ticket open to deploy. This is the number that actually answers “did it get faster to ship,” independent of how many PRs that work was divided into. A team that closes the same amount of real work in less wall-clock time has a genuine productivity story; a team that opens more PRs in the same wall-clock time does not.
- Revert rate and post-merge defect rate. Faster PR creation that produces more rollbacks, hotfixes, or production incidents is not a net gain — it is moved cost, from the writing phase to the operating phase. If AI-assisted PRs show a higher revert rate than the baseline, that gap needs to be in the same report as the spend number.
- Qualitative signal from the engineers actually reviewing the work. The most useful quotes in the Pragmatic Engineer piece did not come from a dashboard — they came from asking a staff engineer directly whether things felt faster. “Development speed had not increased much” and “we don’t see anything getting done faster” are data points a PR-count chart cannot produce on its own. A short, repeated survey of senior engineers and reviewers, asked the same way every quarter, catches drift that activity metrics miss.
The honest conclusion
The data in this survey does not support either a clean “AI coding tools are paying off” story or a clean “it’s all hype” story. It supports a company-specific, contested middle: spend is up everywhere, PR volume is up everywhere and faster than spend, and whether that translates into more value shipped depends on what each team was optimizing for before AI tools arrived and how carefully each team is now checking its own assumption that more PRs means more progress. Engineering leaders who want a real answer for their own organization will need to go look at cycle time, revert rate, and what their own senior engineers say when asked directly — because the PR-count chart, on its own, will tell a flattering story whether or not it is a true one.
Source: Gergely Orosz, “What’s the ROI of software engineers’ spending on AI?“, The Pragmatic Engineer, October 20, 2026.
Related reading
· 6 min read
agents
One Engineer, 832,000 Lines of Rust, 14.5 Weeks — What GitHub's Copilot Rewrite Actually Teaches
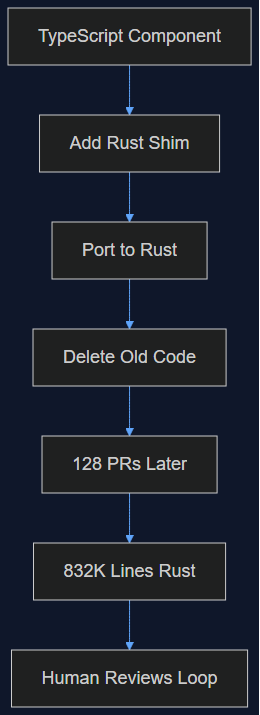
GitHub let Copilot rewrite its own runtime from TypeScript to Rust: 832K lines, 128 PRs, 135 releases, one human in the loop. The regression taxonomy and the incident where two agent sessions overruled each other are worth more than the headline number.
Read more
· 5 min read
agentic coding
10,000 Agents, 88 Hours, One Disputed Proof: What OpenAI's Navier-Stokes Claim Means for Engineering Teams
OpenAI says an internal model coordinated 10,000 agents for 88 hours to solve the Navier-Stokes Millennium Prize problem — then a mathematician accused it of building on unpublished work it had access to. A technical lead's take on the swarm-scale mechanics and the attribution problem every AI-assisted team will eventually hit.
Read more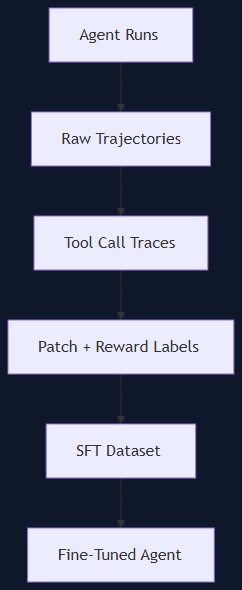
· 5 min read
ai
NVIDIA's Open Data for Agents: What 500K+ Trajectories Teach You About Evaluating Your Own Coding Agent
NVIDIA and Hugging Face published Open-SWE-Traces, SWE-Zero, and SWE-Hero — half a million open agent trajectories with tool calls, patches, and failure cases. A Tech Lead's guide to reusing this format for internal agent evals, not just model fine-tuning.
Read more
Discussion
Comments are reviewed before publication. Your email is kept private.